Financial and accounting reports are critical for management to evaluate the health of a business. Given their importance, these reports should not be boring to read and difficult to understand.
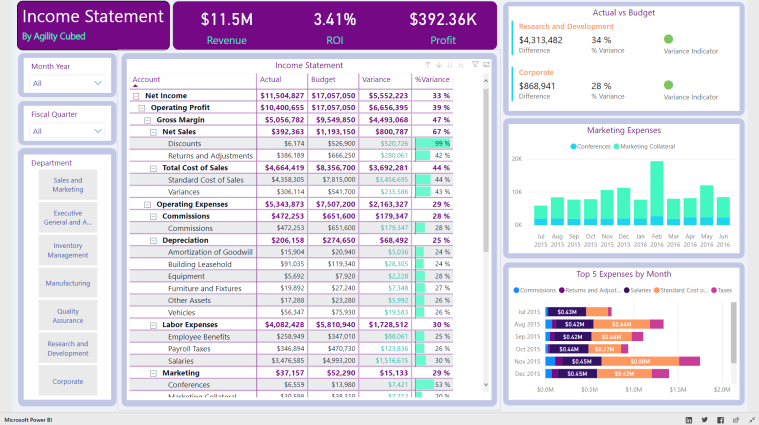
This customized Power BI report features an Income statement that brings attention to the high-level revenue and expense accounts with vivid data bars that show actual vs budget performance. Expand specific row items or the entire statement to drill into the data. With the slicers nicely placed on the left, chop up the report and insights by months, quarters or various departments across the business. Colorful metrics on top change dynamically with each slice. Tailored visuals can give insight to actual vs budget by department, marketing expense breakdowns and much more.
Take control of your business with impressive financial and accounting reports that give you the insight to make intelligent decisions.